FraudLens
the threshold is a business decisionYou are the fraud manager. Drag the line, pay the price — every number below updates from a real model's test-set predictions (56,962 transactions, 75 frauds). Educational simulation.
Draw the line
Lower threshold = stricter guard: more frauds caught, more customers wrongly blocked.
lenient
strict
0.50
–frauds caught (of 75)
–£ slipping through (missed fraud)
–customers wrongly flagged
Cost defaults are illustrative, not research claims — set them to your business. “Amount-aware” prices each missed fraud at its actual transaction value.
The price of your line
Total cost across every possible threshold. Green pulse = the cheapest point.
Where it fails
Every dot is a real fraud: score vs £ amount. Left of your line = missed. Notice the misses skew high-value.
Why did the model say that?
Pick a transaction — the bars show which features pushed it toward fraud (red) or legit (green). V-features are anonymised, so we see which feature mattered, not a human reason.
Is the blind spot the model — or the data?
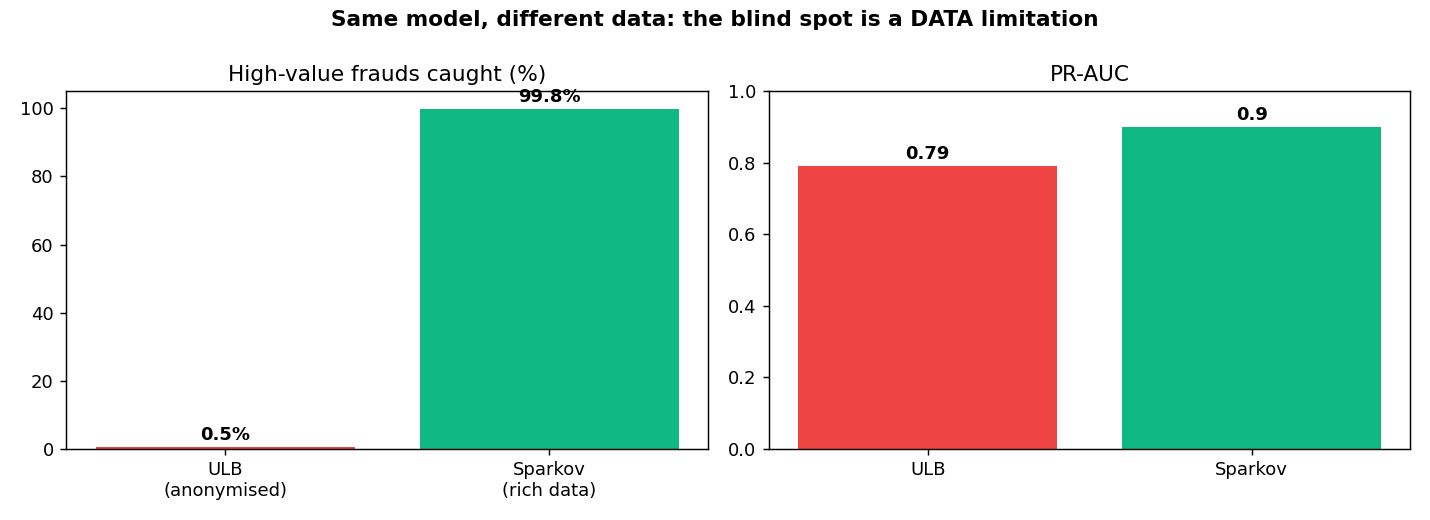
This model misses high-value frauds. The same cost-based pipeline, rerun on a dataset with customer-behaviour signals, catches them.
ULB (anonymised data)
~0%of high-value frauds caught · PR-AUC 0.79
Sparkov (rich data, +1 behaviour feature)
99.8%of high-value frauds caught · PR-AUC 0.90
Same algorithm, same approach — only the data changed. The blind spot is a data limitation, not a model one.
How honest is this?
illustrative costs
75-fraud test fold
synthetic proof dataset
precomputed & auditable